Web Edition
Supply is available. Cost and market-structure risk remain elevated.
View Designed Edition2 original publication pagesExecutive Summary
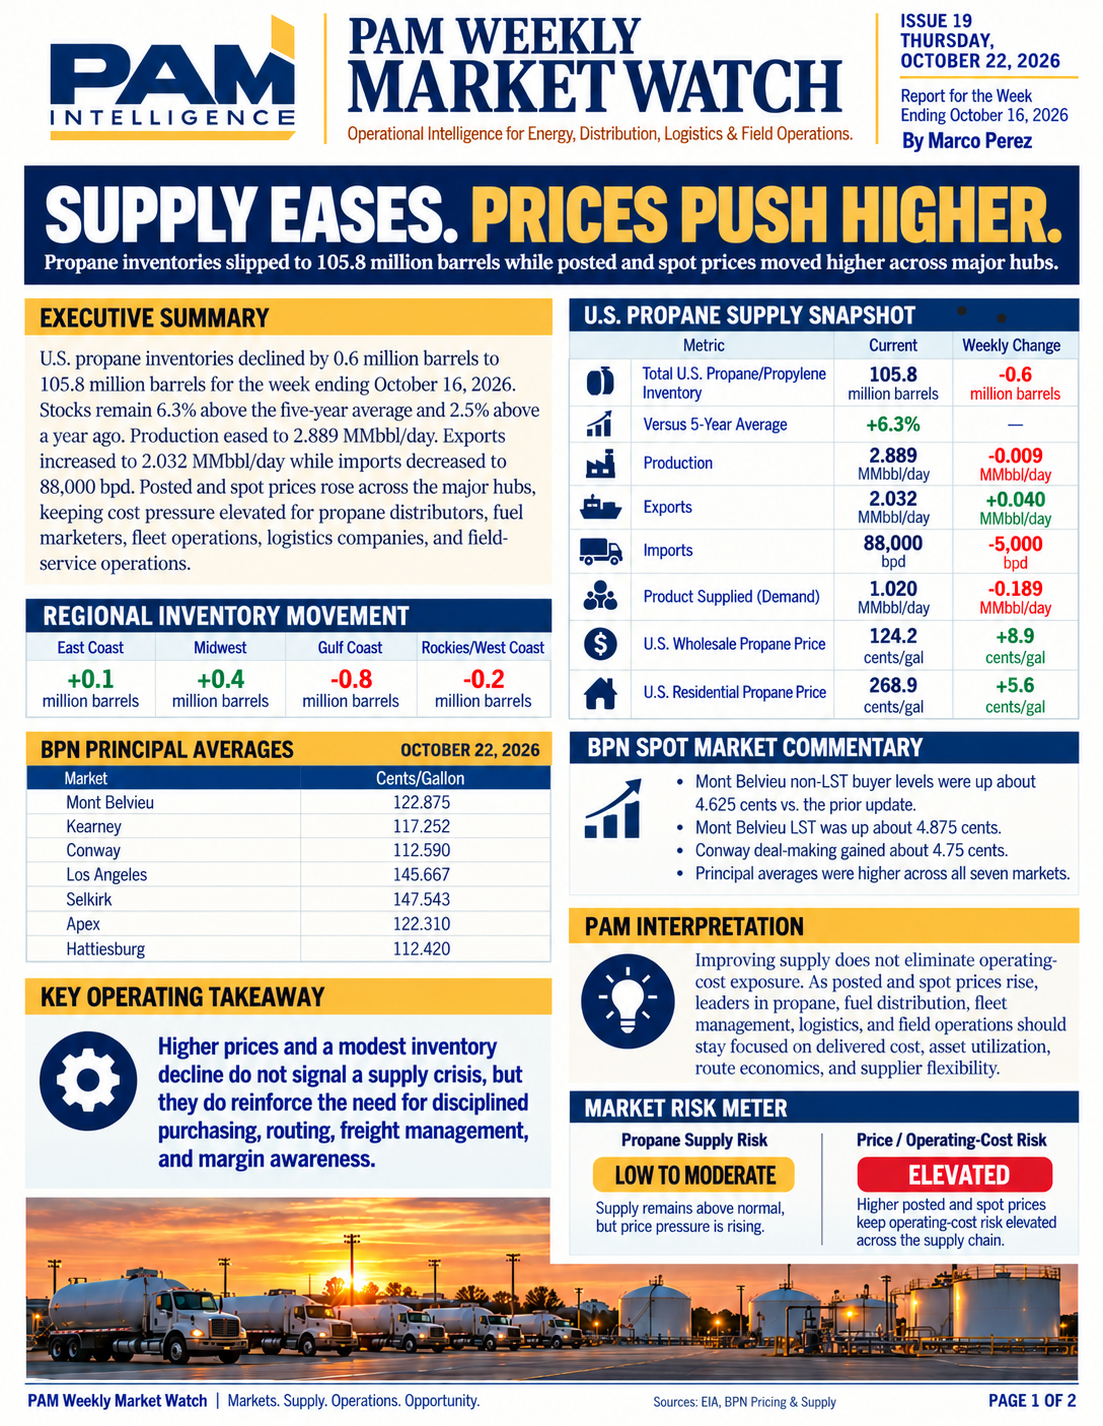
U.S. propane inventories declined by 0.6 million barrels to 105.8 million barrels for the week ending October 16, 2026. Stocks remained 6.3% above the five-year average and 2.5% above a year ago. Production eased to 2.889 MMbbl/day. Exports increased to 2.032 MMbbl/day while imports decreased to 88,000 bpd. Posted and spot prices rose across the major hubs, keeping cost pressure elevated for propane distributors, fuel marketers, fleet operations, logistics companies, and field-service operations.
U.S. Propane Supply Snapshot
| Metric | Current | Weekly change |
|---|---|---|
| Total U.S. propane/propylene inventory | 105.8 million barrels | −0.6 million barrels |
| Versus five-year average | +6.3% | — |
| Production | 2.889 MMbbl/day | −0.009 MMbbl/day |
| Exports | 2.032 MMbbl/day | +0.040 MMbbl/day |
| Imports | 88,000 bpd | −5,000 bpd |
| Product supplied (demand) | 1.020 MMbbl/day | −0.189 MMbbl/day |
| U.S. wholesale propane price | 124.2 cents/gallon | +8.9 cents/gallon |
| U.S. residential propane price | 268.9 cents/gallon | +5.6 cents/gallon |
Regional Inventory Movement
- East Coast: +0.1 million barrels
- Midwest: +0.4 million barrels
- Gulf Coast: −0.8 million barrels
- Rockies/West Coast: −0.2 million barrels
BPN Principal Averages — October 22, 2026
| Market | Cents/gallon |
|---|---|
| Mont Belvieu | 122.875 |
| Kearney | 117.252 |
| Conway | 112.590 |
| Los Angeles | 145.667 |
| Selkirk | 147.543 |
| Apex | 122.310 |
| Hattiesburg | 112.420 |
BPN Spot Market Commentary
- Mont Belvieu non-LST buyer levels were up about 4.625 cents versus the prior update.
- Mont Belvieu LST was up about 4.875 cents.
- Conway deal-making gained about 4.75 cents.
- Principal averages were higher across all seven markets.
PAM interpretation: Improving supply does not eliminate operating-cost exposure. As posted and spot prices rise, leaders should stay focused on delivered cost, asset utilization, route economics, and supplier flexibility.
Diesel & Fleet Operations
| Region | Price | Weekly change |
|---|---|---|
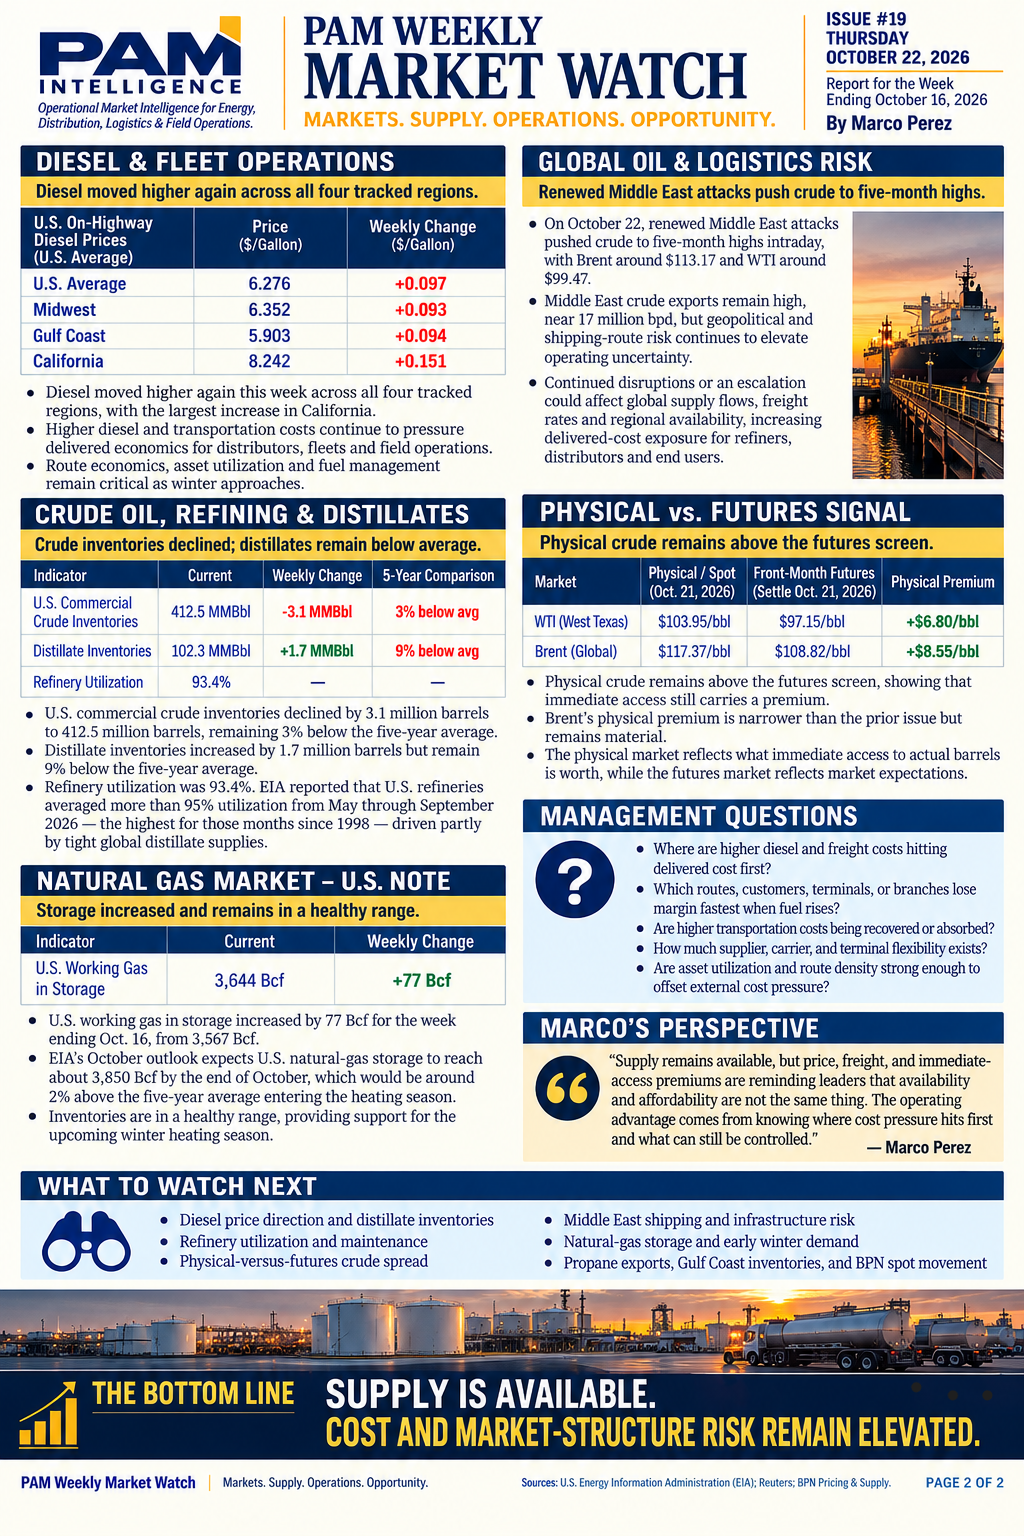
| U.S. average | $6.276 | +$0.097 |
| Midwest | $6.352 | +$0.093 |
| Gulf Coast | $5.903 | +$0.094 |
| California | $8.242 | +$0.151 |
Diesel moved higher across all four tracked regions. Higher diesel and transportation costs continued to pressure delivered economics. Route economics, asset utilization, and fuel management remained critical as winter approached.
Crude Oil, Refining & Distillates
| Indicator | Current | Weekly change | Five-year comparison |
|---|---|---|---|
| U.S. commercial crude inventories | 412.5 MMbbl | −3.1 MMbbl | 3% below average |
| Distillate inventories | 102.3 MMbbl | +1.7 MMbbl | 9% below average |
| Refinery utilization | 93.4% | — | — |
EIA reported that U.S. refineries averaged more than 95% utilization from May through September 2026—the highest for those months since 1998—driven partly by tight global distillate supplies.
Natural Gas Market — U.S. Note
U.S. working gas in storage increased by 77 Bcf for the week ending October 16, from 3,567 Bcf to 3,644 Bcf. EIA’s October outlook expected storage to reach about 3,850 Bcf by the end of October, around 2% above the five-year average entering heating season.
Global Oil & Logistics Risk
- On October 22, renewed Middle East attacks pushed crude to five-month highs intraday, with Brent around $113.17 and WTI around $99.47.
- Middle East crude exports remained high, near 17 million bpd, but geopolitical and shipping-route risk continued to elevate operating uncertainty.
- Continued disruptions or escalation could affect global supply flows, freight rates, and regional availability.
Physical vs. Futures Signal
| Market | Physical/spot (Oct. 21) | Front-month futures (settle Oct. 21) | Physical premium |
|---|---|---|---|
| WTI | $103.95/bbl | $97.15/bbl | +$6.80/bbl |
| Brent | $117.37/bbl | $108.82/bbl | +$8.55/bbl |
Physical crude remained above the futures screen, showing that immediate access still carried a premium.
Management Questions
- Where are higher diesel and freight costs hitting delivered cost first?
- Which routes, customers, terminals, or branches lose margin fastest when fuel rises?
- Are higher transportation costs being recovered or absorbed?
- How much supplier, carrier, and terminal flexibility exists?
- Are asset utilization and route density strong enough to offset external cost pressure?
What to Watch Next
- Diesel price direction and distillate inventories
- Refinery utilization and maintenance
- Physical-versus-futures crude spread
- Middle East shipping and infrastructure risk
- Natural-gas storage and early winter demand
- Propane exports, Gulf Coast inventories, and BPN spot movement
Marco’s Perspective: “Supply remains available, but price, freight, and immediate-access premiums are reminding leaders that availability and affordability are not the same thing. The operating advantage comes from knowing where cost pressure hits first and what can still be controlled.”