Web Edition
Propane availability remained comfortable, but the economics of moving and delivering energy were under pressure.
View Designed Edition2 original publication pagesExecutive Summary
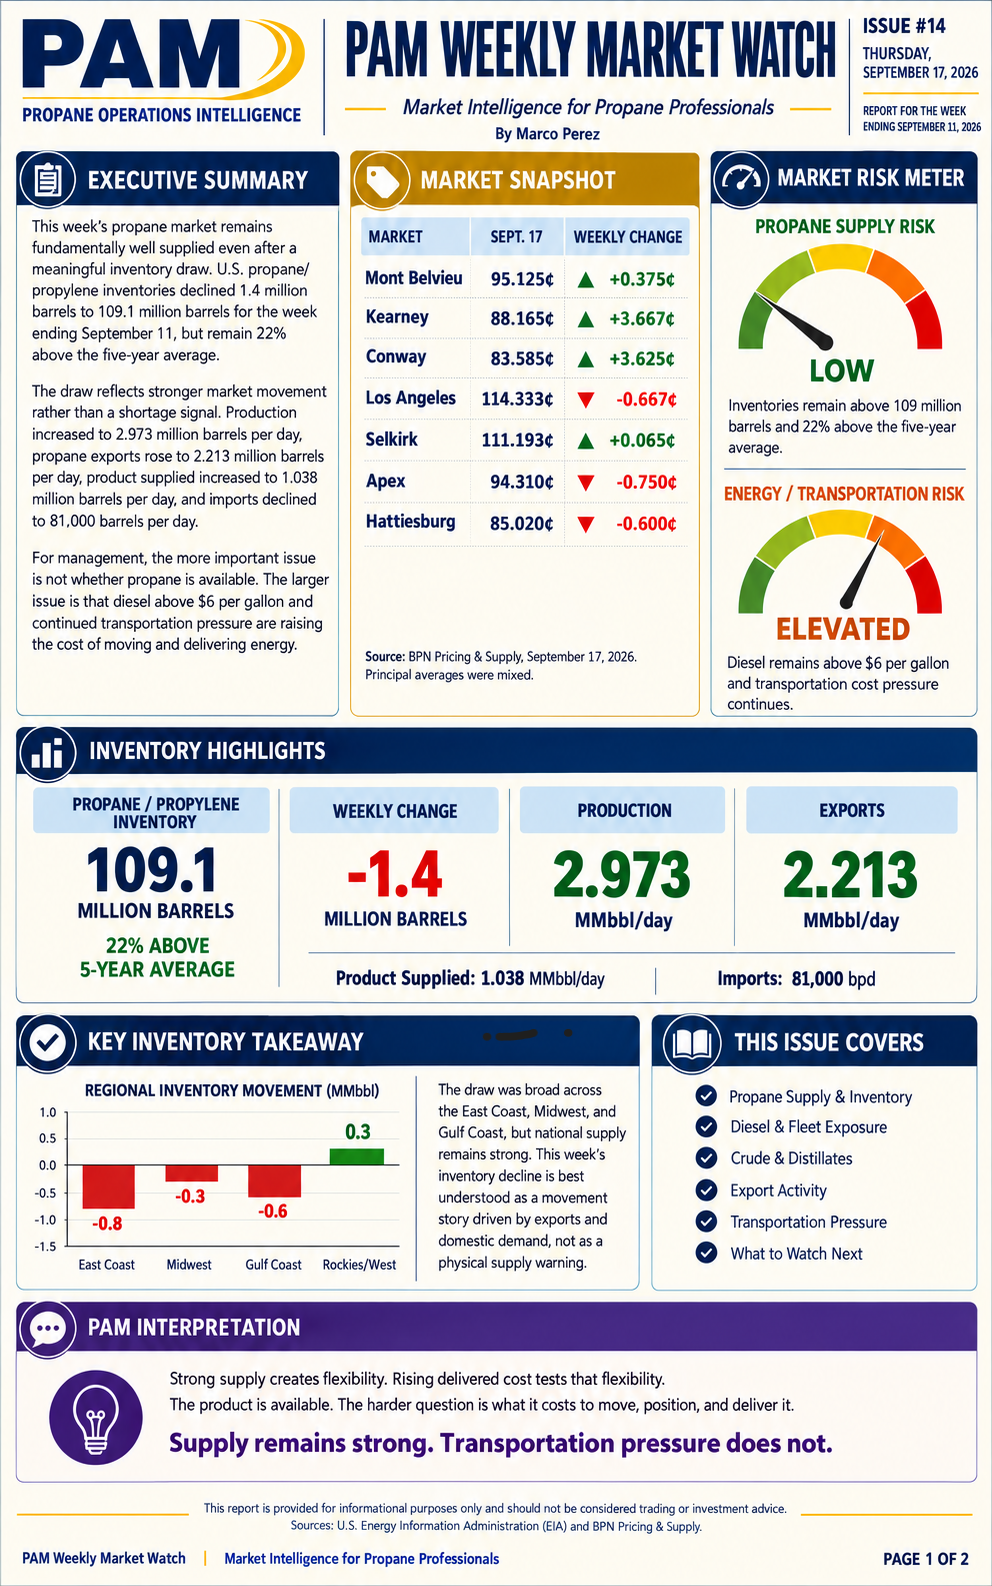
This week’s propane market remained fundamentally well supplied even after a meaningful inventory draw. U.S. propane/propylene inventories declined 1.4 million barrels to 109.1 million barrels for the week ending September 11, but remained 22% above the five-year average.
The draw reflected stronger market movement rather than a shortage signal. Production increased to 2.973 million barrels per day, propane exports rose to 2.213 million barrels per day, product supplied increased to 1.038 million barrels per day, and imports declined to 81,000 barrels per day.
For management, the more important issue was not whether propane was available. Diesel above $6 per gallon and continuing transportation pressure were raising the cost of moving and delivering energy.
Core conclusion: Supply remains strong. Transportation pressure does not.
Market Snapshot — September 17, 2026
| Market | Price | Weekly change |
|---|---|---|
| Mont Belvieu | 95.125¢ | +0.375¢ |
| Kearney | 88.165¢ | +3.667¢ |
| Conway | 83.585¢ | +3.625¢ |
| Los Angeles | 114.333¢ | −0.667¢ |
| Selkirk | 111.193¢ | +0.065¢ |
| Apex | 94.310¢ | −0.750¢ |
| Hattiesburg | 85.020¢ | −0.600¢ |
Source: BPN Pricing & Supply — September 17, 2026. Principal averages were mixed.
Propane & Supply Position
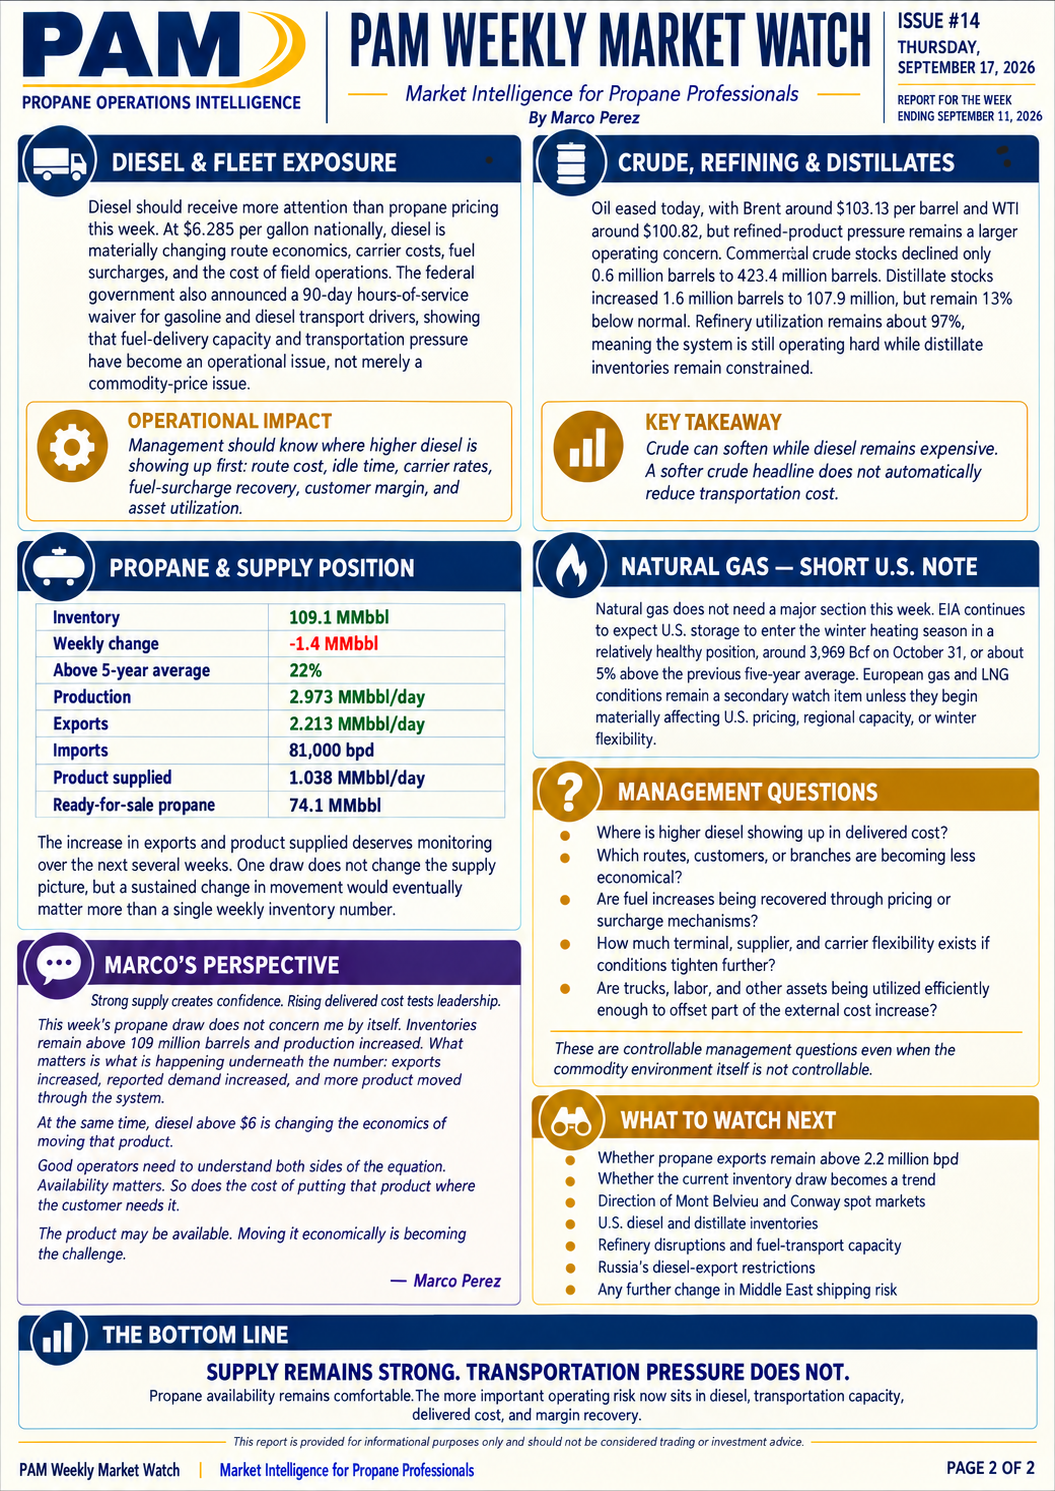
| Inventory | 109.1 MMbbl |
|---|---|
| Weekly change | −1.4 MMbbl |
| Above five-year average | 22% |
| Production | 2.973 MMbbl/day |
| Exports | 2.213 MMbbl/day |
| Imports | 81,000 bpd |
| Product supplied | 1.038 MMbbl/day |
| Ready-for-sale propane | 74.1 MMbbl |
The increase in exports and product supplied deserved monitoring over the next several weeks. One draw did not change the supply picture, but a sustained change in movement would eventually matter more than a single weekly inventory number.
Regional Inventory Movement
- East Coast: −0.8 million barrels
- Midwest: −0.3 million barrels
- Gulf Coast: −0.6 million barrels
- Rockies/West: +0.3 million barrels
The draw was broad across the East Coast, Midwest, and Gulf Coast, but national supply remained strong. The decline was best understood as a movement story driven by exports and domestic demand, not as a physical supply warning.
Historical Risk Interpretation
Propane supply risk: LOW. Inventories remained above 109 million barrels and 22% above the five-year average.
Energy/transportation risk: ELEVATED. Diesel remained above $6 per gallon and transportation cost pressure continued.
These are PAM’s historical assessments as of September 17, 2026. They are not current status indicators.
Diesel & Fleet Exposure
Diesel deserved more attention than propane pricing in this report. At approximately $6.285 per gallon nationally, diesel was materially changing route economics, carrier costs, fuel surcharges, and the cost of field operations. The federal government had also announced a 90-day hours-of-service waiver for gasoline and diesel transport drivers, showing that fuel-delivery capacity and transportation pressure had become an operational issue, not merely a commodity-price issue.
Crude, Refining & Distillates
Oil eased, with Brent around $103.13 per barrel and WTI around $100.82, but refined-product pressure remained a larger operating concern. Commercial crude stocks declined 0.6 million barrels to 423.4 million barrels. Distillate stocks increased 1.6 million barrels to 107.9 million barrels, but remained 13% below normal. Refinery utilization remained about 97%, meaning the system was still operating hard while distillate inventories remained constrained.
Key takeaway: Crude can soften while diesel remains expensive. A softer crude headline does not automatically reduce transportation cost.
Natural Gas — Short U.S. Note
Natural gas did not require a major section in this report. EIA continued to expect U.S. storage to enter the winter heating season in a relatively healthy position, around 3,969 Bcf on October 31, or about 5% above the previous five-year average. European gas and LNG conditions remained a secondary watch item unless they began materially affecting U.S. pricing, regional capacity, or winter flexibility.
This statement is preserved as historical context from September 17, 2026.
Management Questions
- Where is higher diesel showing up in delivered cost?
- Which routes, customers, or branches are becoming less economical?
- Are fuel increases being recovered through pricing or surcharge mechanisms?
- How much terminal, supplier, and carrier flexibility exists if conditions tighten further?
- Are trucks, labor, and other assets being utilized efficiently enough to offset part of the external cost increase?
These were controllable management questions even when the commodity environment itself was not controllable.
What to Watch Next
- Whether propane exports remained above 2.2 million barrels per day
- Whether the current inventory draw became a trend
- Direction of Mont Belvieu and Conway spot markets
- U.S. diesel and distillate inventories
- Refinery disruptions and fuel-transport capacity
- Russia’s diesel-export restrictions
- Any further change in Middle East shipping risk
This watch list is preserved as historical forward-looking context from September 17, 2026.
Marco’s Perspective
Strong supply creates confidence. Rising delivered cost tests leadership.
This week’s propane draw did not concern me by itself. Inventories remained above 109 million barrels and production increased. What mattered was what was happening underneath the number: exports increased, reported demand increased, and more product moved through the system.
At the same time, diesel above $6 was changing the economics of moving that product. Good operators needed to understand both sides of the equation. Availability matters. So does the cost of putting that product where the customer needs it.
The product may be available. Moving it economically is becoming the challenge.
ASK PAM
Put This Market Watch to Work
Management question: “Propane supply looks strong. What should management measure if transportation and delivered costs are rising?”
- What is happening? As of September 17, 2026, physical propane supply was strong, but diesel and transportation pressure were increasing delivered cost.
- What should we measure? Track route cost, miles, idle time, gallons and stops per route, carrier rates, fuel surcharges, customer margin, asset utilization, and cost recovery.
- What may be causing it? Higher diesel, inefficient route structure, limited carrier or terminal flexibility, weak surcharge recovery, and underused assets can compound external pressure.
- What can management control? Route design, carrier strategy, terminal and supplier options, surcharge discipline, customer and branch economics, and utilization of trucks and labor.
- What decision may need to be made? Leaders may need to reprice, reroute, change supply or carrier options, or stop accepting work whose delivered cost cannot be supported.
- What practical step comes next? Review one week of route and delivery economics by branch and identify where diesel and transportation cost are appearing first.
This answer uses the report’s dated September 17, 2026 evidence and approved PAM operational principles. It does not represent current market conditions.