Web Edition
Why Transportation, Refined Fuels, and Logistics Cost Pressure May Be the More Immediate Operational Threat
View Designed Edition4 original publication pagesRevised Executive Summary
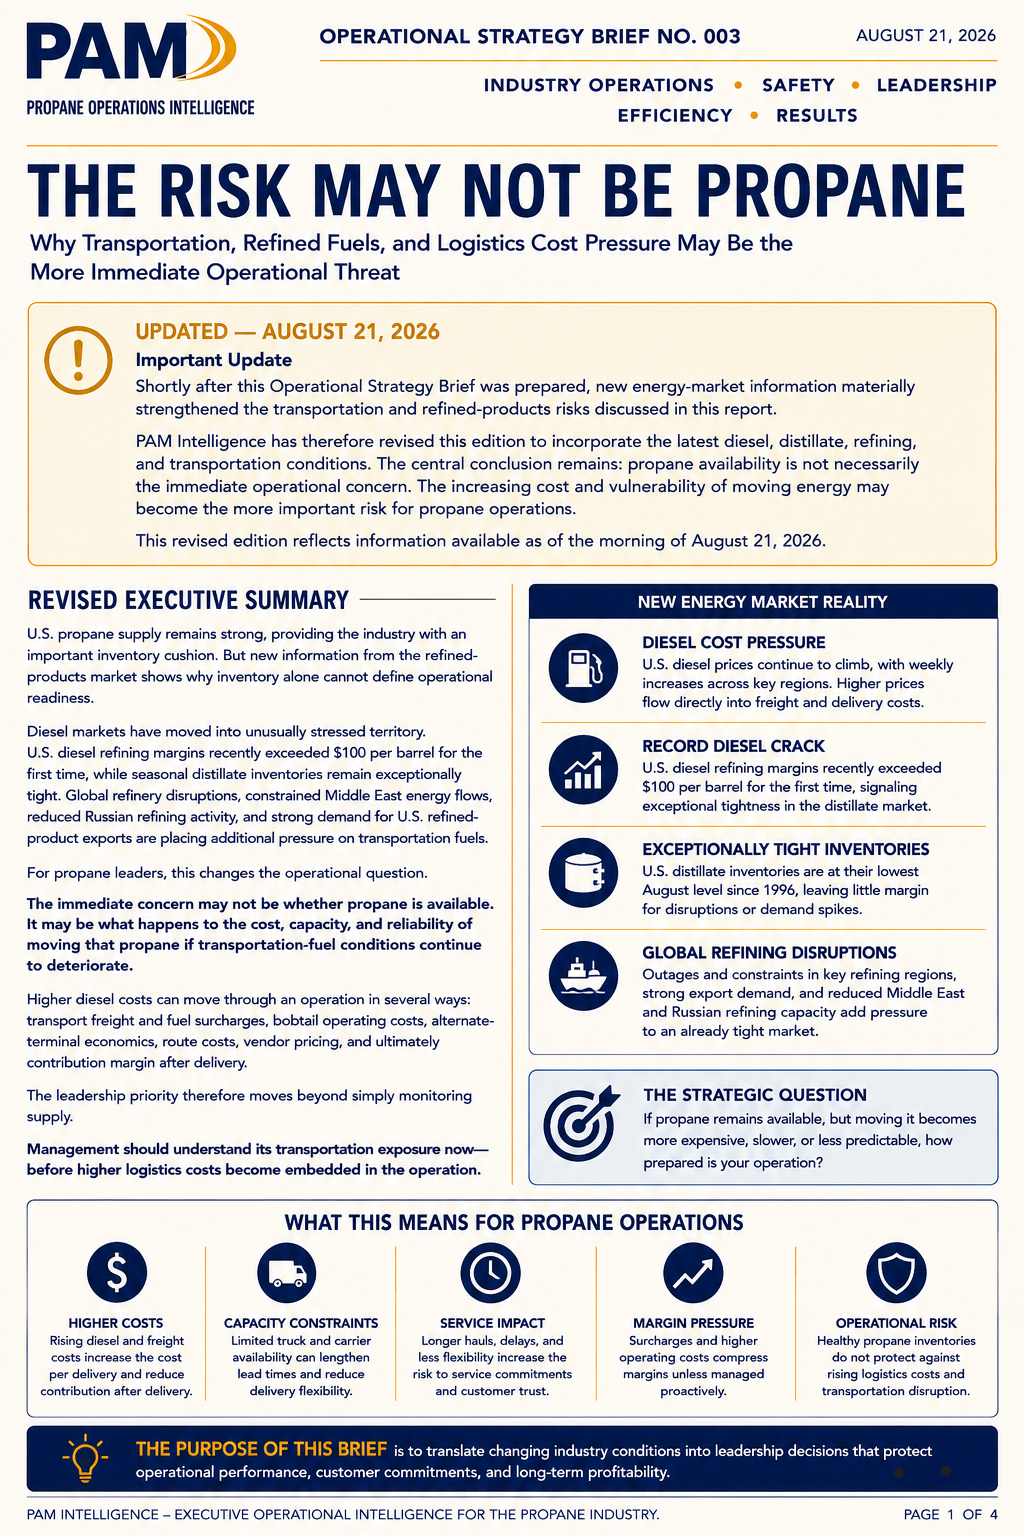
U.S. propane supply remains strong, providing the industry with an important inventory cushion. But new information from the refined-products market shows why inventory alone cannot define operational readiness.
Diesel markets have moved into unusually stressed territory. U.S. diesel refining margins recently exceeded $100 per barrel for the first time, while seasonal distillate inventories remain exceptionally tight. Global refinery disruptions, constrained Middle East energy flows, reduced Russian refining activity, and strong demand for U.S. refined-product exports are placing additional pressure on transportation fuels.
For propane leaders, this changes the operational question.
The immediate concern may not be whether propane is available.
It may be what happens to the cost, capacity, and reliability of moving that propane if transportation-fuel conditions continue to deteriorate.
Higher diesel costs can move through an operation in several ways: transport freight and fuel surcharges, bobtail operating costs, alternate-terminal economics, route costs, vendor pricing, and ultimately contribution margin after delivery.
The leadership priority therefore moves beyond simply monitoring supply.
Management should understand its transportation exposure now—before higher logistics costs become embedded in the operation.
New Energy Market Reality
Diesel Cost Pressure
U.S. diesel prices continue to climb, with weekly increases across key regions. Higher prices flow directly into freight and delivery costs.
Record Diesel Crack
U.S. diesel refining margins recently exceeded $100 per barrel for the first time, signaling exceptional tightness in the distillate market.
Exceptionally Tight Inventories
U.S. distillate inventories are at their lowest August level since 1996, leaving little margin for disruptions or demand spikes.
Global Refining Disruptions
Outages and constraints in key refining regions, strong export demand, and reduced Middle East and Russian refining capacity add pressure to an already tight market.
What This Means for Propane Operations
Higher Costs
Rising diesel and freight costs increase the cost per delivery and reduce contribution after delivery.
Capacity Constraints
Limited truck and carrier availability can lengthen lead times and reduce delivery flexibility.
Service Impact
Longer hauls, delays, and less flexibility increase the risk to service commitments and customer trust.
Margin Pressure
Surcharges and higher operating costs compress margins unless managed proactively.
Operational Risk
Healthy propane inventories do not protect against rising logistics costs and transportation disruption.
The Energy Environment Driving Transportation Risk
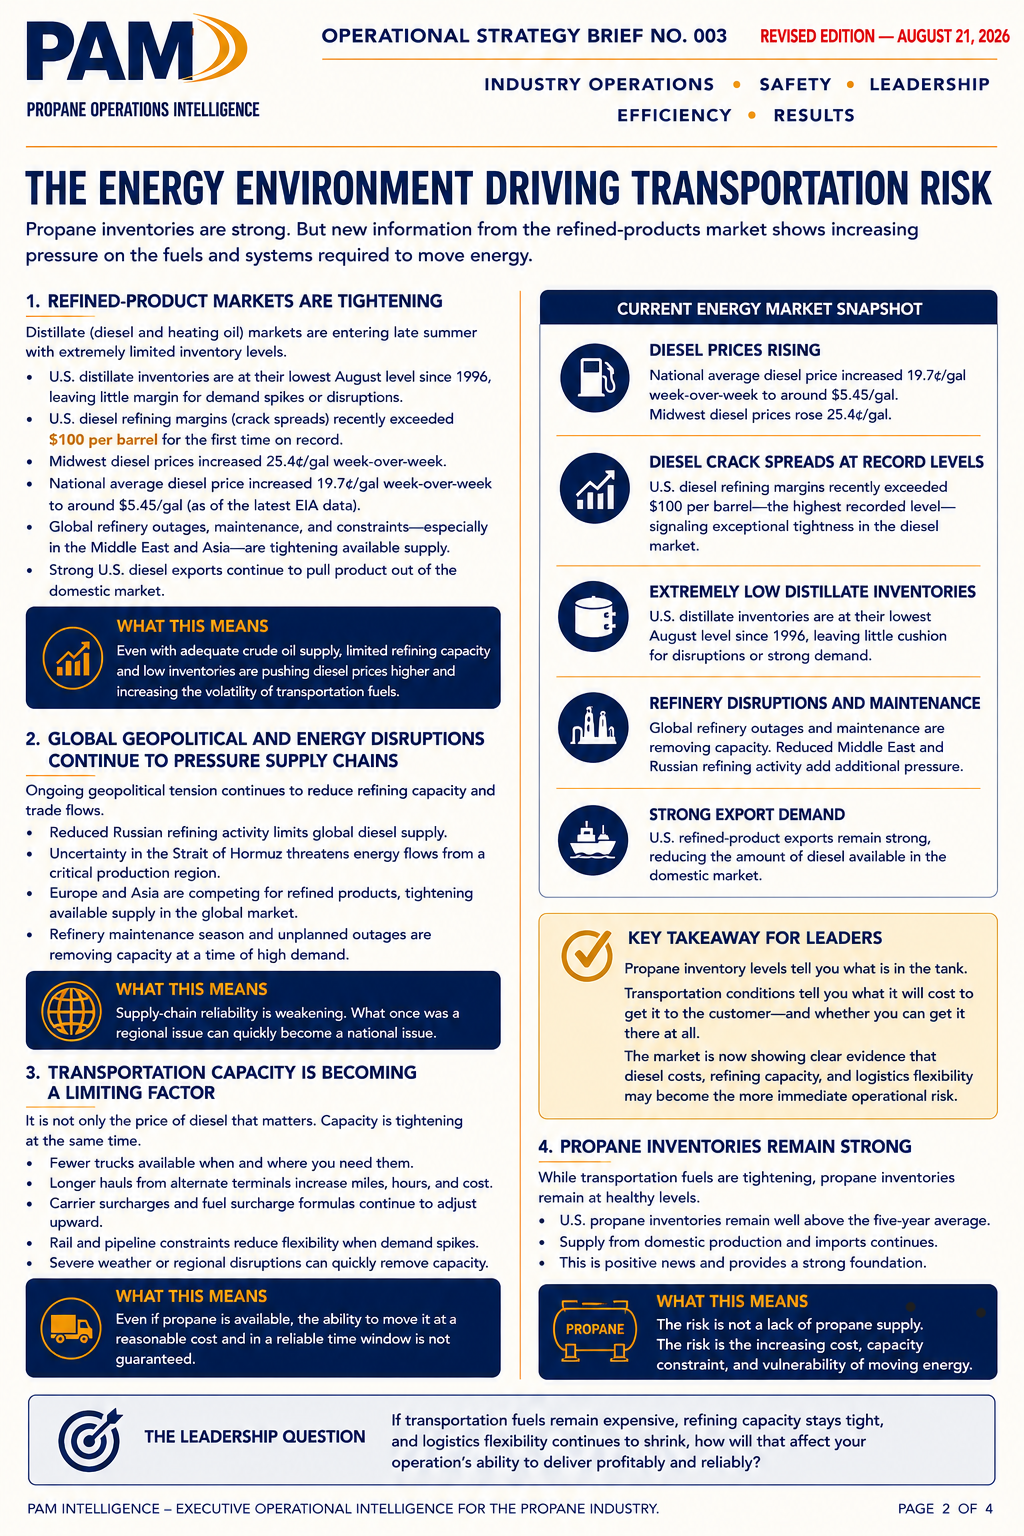
Propane inventories are strong. But new information from the refined-products market shows increasing pressure on the fuels and systems required to move energy.
1. Refined-Product Markets Are Tightening
Distillate (diesel and heating oil) markets are entering late summer with extremely limited inventory levels.
- U.S. distillate inventories are at their lowest August level since 1996, leaving little margin for demand spikes or disruptions.
- U.S. diesel refining margins (crack spreads) recently exceeded $100 per barrel for the first time on record.
- Midwest diesel prices increased 25.4¢/gal week-over-week.
- National average diesel price increased 19.7¢/gal week-over-week to around $5.45/gal (as of the latest EIA data).
- Global refinery outages, maintenance, and constraints—especially in the Middle East and Asia—are tightening available supply.
- Strong U.S. diesel exports continue to pull product out of the domestic market.
2. Global Geopolitical and Energy Disruptions Continue to Pressure Supply Chains
Ongoing geopolitical tension continues to reduce refining capacity and trade flows.
- Reduced Russian refining activity limits global diesel supply.
- Uncertainty in the Strait of Hormuz threatens energy flows from a critical production region.
- Europe and Asia are competing for refined products, tightening available supply in the global market.
- Refinery maintenance season and unplanned outages are removing capacity at a time of high demand.
3. Transportation Capacity Is Becoming a Limiting Factor
It is not only the price of diesel that matters. Capacity is tightening at the same time.
- Fewer trucks available when and where you need them.
- Longer hauls from alternate terminals increase miles, hours, and cost.
- Carrier surcharges and fuel surcharge formulas continue to adjust upward.
- Rail and pipeline constraints reduce flexibility when demand spikes.
- Severe weather or regional disruptions can quickly remove capacity.
Current Energy Market Snapshot
Diesel Prices Rising
National average diesel price increased 19.7¢/gal week-over-week to around $5.45/gal.
Midwest diesel prices rose 25.4¢/gal.
Diesel Crack Spreads at Record Levels
U.S. diesel refining margins recently exceeded $100 per barrel—the highest recorded level—signaling exceptional tightness in the diesel market.
Extremely Low Distillate Inventories
U.S. distillate inventories are at their lowest August level since 1996, leaving little cushion for disruptions or strong demand.
Refinery Disruptions and Maintenance
Global refinery outages and maintenance are removing capacity. Reduced Middle East and Russian refining activity add additional pressure.
Strong Export Demand
U.S. refined-product exports remain strong, reducing the amount of diesel available in the domestic market.
4. Propane Inventories Remain Strong
While transportation fuels are tightening, propane inventories remain at healthy levels.
- U.S. propane inventories remain well above the five-year average.
- Supply from domestic production and imports continues.
- This is positive news and provides a strong foundation.
The Operational Impact: Transportation Cost Pressure
Tight diesel and refined-product markets do not stay in the news—they show up in your operation.
Higher fuel costs, surcharges, and reduced logistics flexibility increase your cost per delivery and reduce contribution margin after delivery.
1. How Transportation Costs Flow Into Your Operation
Diesel Prices and Crack Spreads
Higher diesel prices and record crack spreads increase the cost of every mile in the supply chain and in your fleet.
Transportation Surcharges
Freight rates and fuel surcharge formulas rise. Surcharges are passed through to your delivered cost.
Supply Point Economics
Alternate terminals may require more miles or higher freight. The “cheapest gallon” may not be the best delivered cost.
Bobtail Operating Costs
Fuel, DEF, maintenance, tires, and wear increase. Idle time, traffic, and longer miles reduce efficiency.
Service and Capacity Impact
Fewer trucks and drivers available. Longer hauls mean fewer deliveries per day and potential service delays.
Margin and Cash Flow Pressure
All of the above reduce gross margin after delivery and put pressure on cash flow and profitability.
2. What It Can Do to Your Cost per Delivery
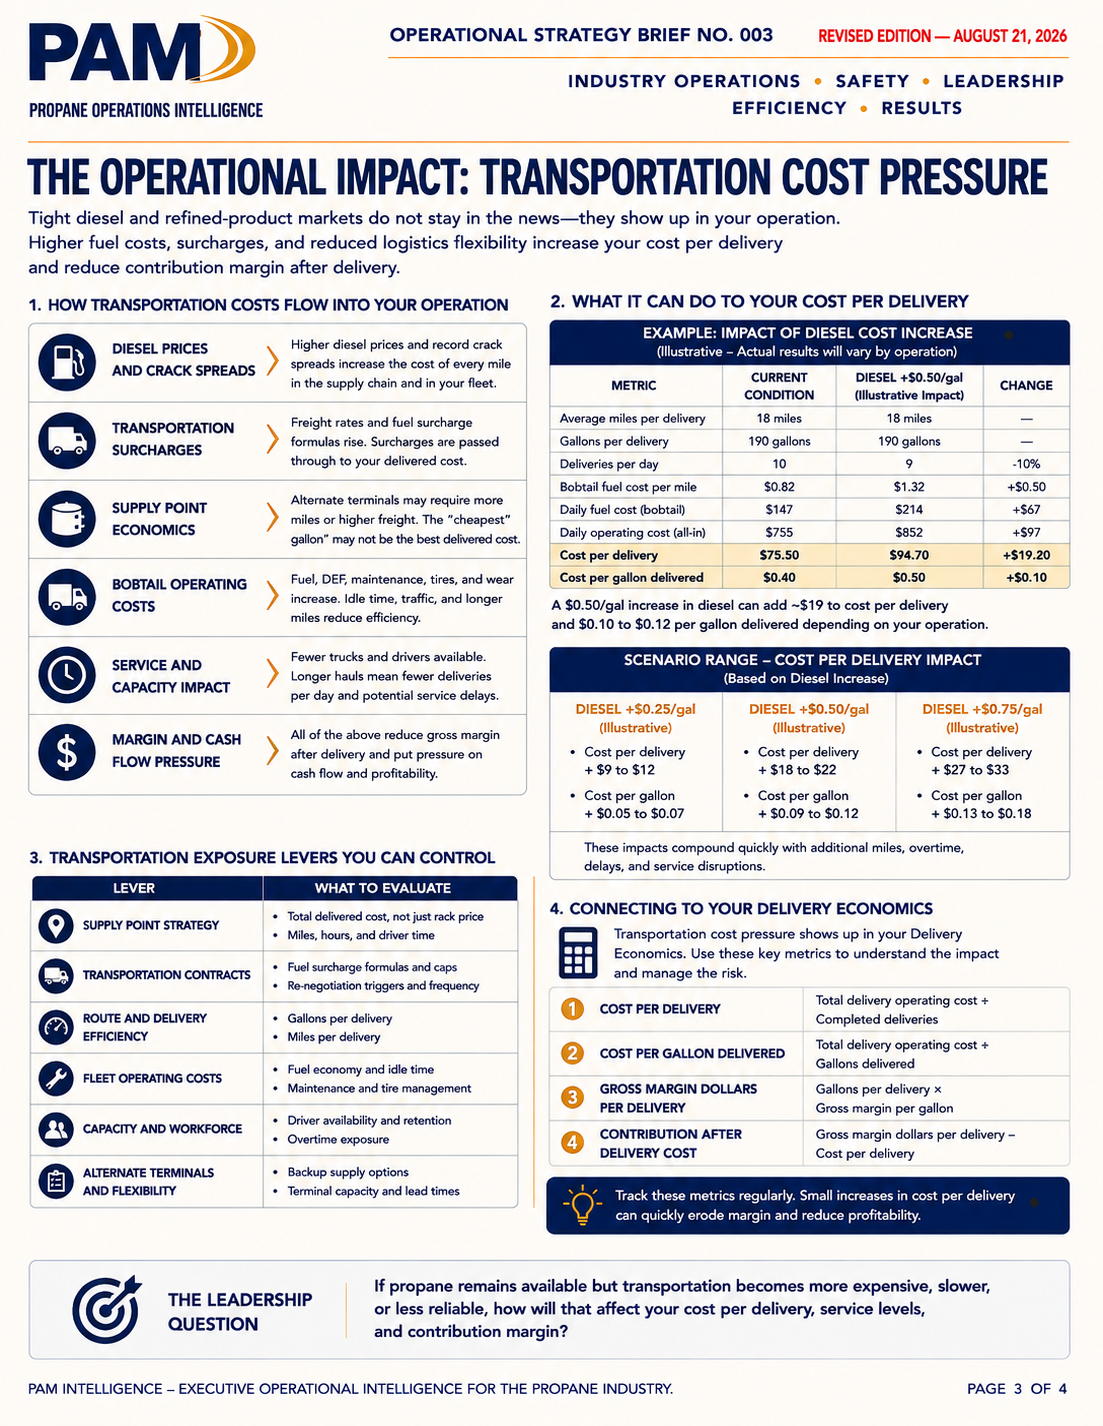
Example: Impact of Diesel Cost Increase
Illustrative — Actual results will vary by operation
| Metric | Current Condition | Diesel +$0.50/gal Illustrative Impact | Change |
|---|---|---|---|
| Average miles per delivery | 18 miles | 18 miles | — |
| Gallons per delivery | 190 gallons | 190 gallons | — |
| Deliveries per day | 10 | 9 | -10% |
| Bobtail fuel cost per mile | $0.82 | $1.32 | +$0.50 |
| Daily fuel cost (bobtail) | $147 | $214 | +$67 |
| Daily operating cost (all-in) | $755 | $852 | +$97 |
| Cost per delivery | $75.50 | $94.70 | +$19.20 |
| Cost per gallon delivered | $0.40 | $0.50 | +$0.10 |
A $0.50/gal increase in diesel can add ~$19 to cost per delivery and $0.10 to $0.12 per gallon delivered depending on your operation.
Scenario Range — Cost per Delivery Impact
Based on Diesel Increase
Diesel +$0.25/gal — Illustrative
- Cost per delivery: +$9 to $12
- Cost per gallon: +$0.05 to $0.07
Diesel +$0.50/gal — Illustrative
- Cost per delivery: +$18 to $22
- Cost per gallon: +$0.09 to $0.12
Diesel +$0.75/gal — Illustrative
- Cost per delivery: +$27 to $33
- Cost per gallon: +$0.13 to $0.18
These impacts compound quickly with additional miles, overtime, delays, and service disruptions.
3. Transportation Exposure Levers You Can Control
Supply Point Strategy
What to evaluate:
- Total delivered cost, not just rack price
- Miles, hours, and driver time
Transportation Contracts
What to evaluate:
- Fuel surcharge formulas and caps
- Re-negotiation triggers and frequency
Route and Delivery Efficiency
What to evaluate:
- Gallons per delivery
- Miles per delivery
Fleet Operating Costs
What to evaluate:
- Fuel economy and idle time
- Maintenance and tire management
Capacity and Workforce
What to evaluate:
- Driver availability and retention
- Overtime exposure
Alternate Terminals and Flexibility
What to evaluate:
- Backup supply options
- Terminal capacity and lead times
4. Connecting to Your Delivery Economics
Transportation cost pressure shows up in your Delivery Economics. Use these key metrics to understand the impact and manage the risk.
- Cost per Delivery
Total delivery operating cost ÷ Completed deliveries - Cost per Gallon Delivered
Total delivery operating cost ÷ Gallons delivered - Gross Margin Dollars per Delivery
Gallons per delivery × Gross margin per gallon - Contribution After Delivery Cost
Gross margin dollars per delivery − Cost per delivery
Leadership Action: Manage Your Transportation Exposure Now
Strong propane inventories protect product availability. They do not protect delivery economics.
Leaders must understand and manage the cost, capacity, and reliability of moving energy.
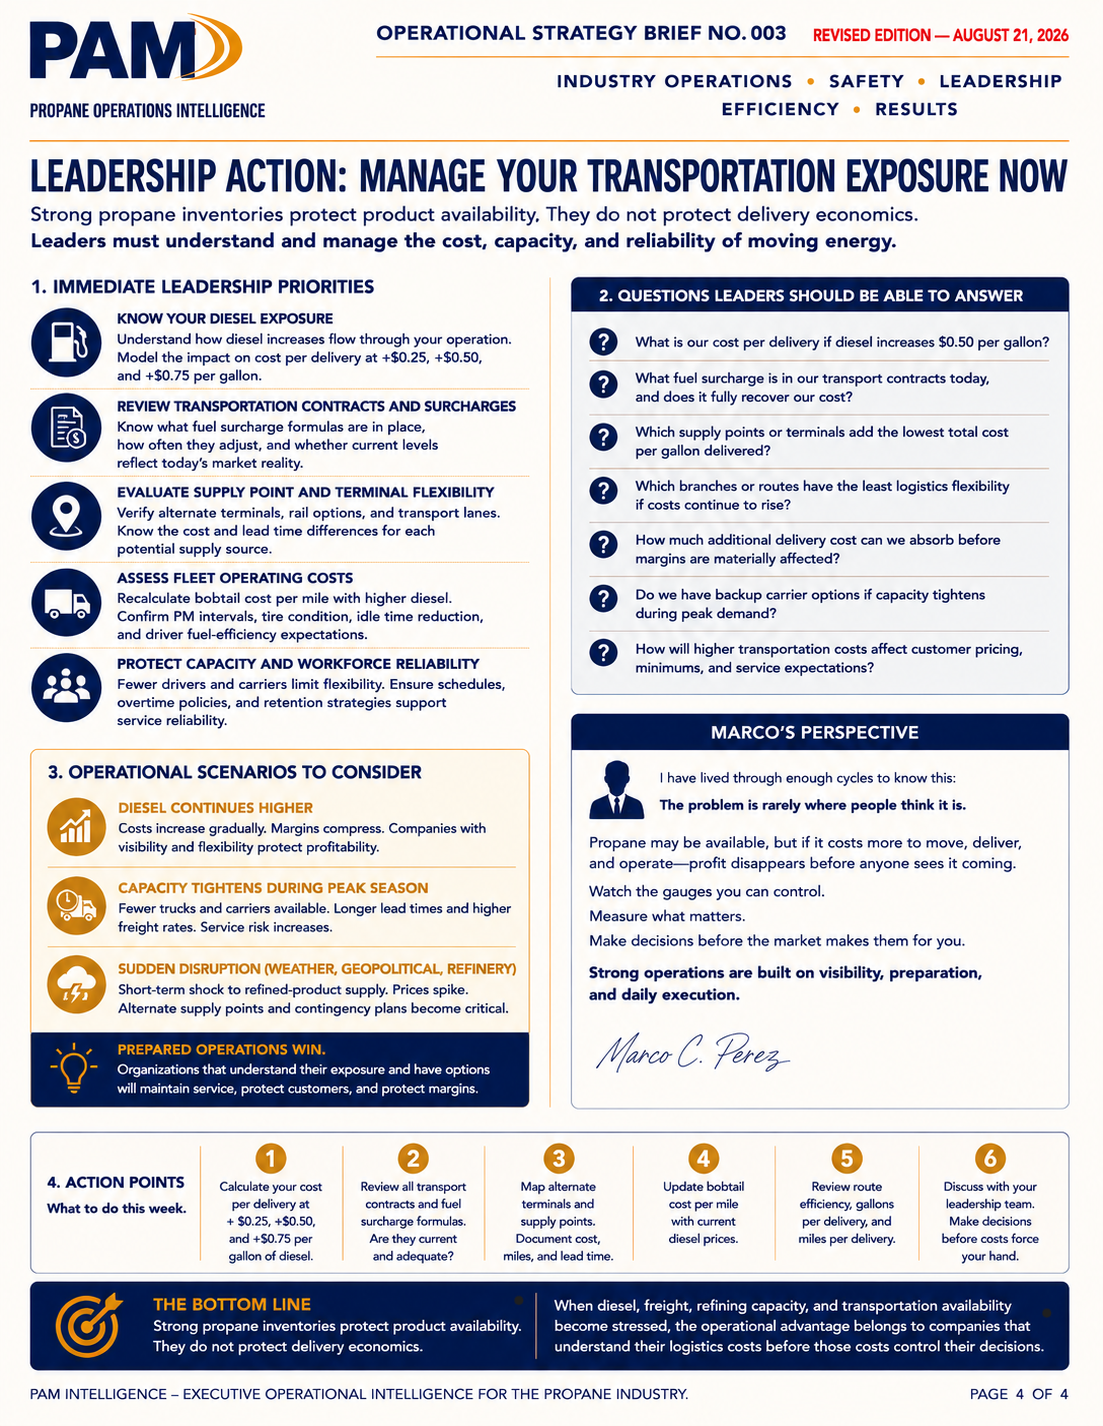
1. Immediate Leadership Priorities
Know Your Diesel Exposure
Understand how diesel increases flow through your operation.
Model the impact on cost per delivery at +$0.25, +$0.50, and +$0.75 per gallon.
Review Transportation Contracts and Surcharges
Know what fuel surcharge formulas are in place, how often they adjust, and whether current levels reflect today’s market reality.
Evaluate Supply Point and Terminal Flexibility
Verify alternate terminals, rail options, and transportation lanes.
Know the cost and lead time differences for each potential supply source.
Assess Fleet Operating Costs
Recalculate bobtail cost per mile with higher diesel.
Confirm PM intervals, tire condition, idle time reduction, and driver fuel-efficiency expectations.
Protect Capacity and Workforce Reliability
Fewer drivers and carriers limit flexibility.
Ensure schedules, overtime policies, and retention strategies support service reliability.
2. Questions Leaders Should Be Able to Answer
- What is our cost per delivery if diesel increases $0.50 per gallon?
- What fuel surcharge is in our transport contracts today, and does it fully recover our cost?
- Which supply points or terminals add the lowest total cost per gallon delivered?
- Which branches or routes have the least logistics flexibility if costs continue to rise?
- How much additional delivery cost can we absorb before margins are materially affected?
- Do we have backup carrier options if capacity tightens during peak demand?
- How will higher transportation costs affect customer pricing, minimums, and service expectations?
3. Operational Scenarios to Consider
Diesel Continues Higher
Costs increase gradually. Margins compress.
Companies with visibility and flexibility protect profitability.
Capacity Tightens During Peak Season
Fewer trucks and carriers available.
Longer lead times and higher freight rates.
Service risk increases.
Sudden Disruption (Weather, Geopolitical, Refinery)
Short-term shock to refined-product supply.
Prices spike.
Alternate supply points and contingency plans become critical.
4. Action Points
What to do this week.
- Calculate your cost per delivery at +$0.25, +$0.50, and +$0.75 per gallon of diesel.
- Review all transport contracts and fuel surcharge formulas. Are they current and adequate?
- Map alternate terminals and supply points. Document cost, miles, and lead time.
- Update bobtail cost per mile with current diesel prices.
- Review route efficiency, gallons per delivery, and miles per delivery.
- Discuss with your leadership team. Make decisions before costs force your hand.