Web Edition
Supply may be adequate. Cost discipline still matters.
View Designed Edition2 original publication pagesExecutive Summary
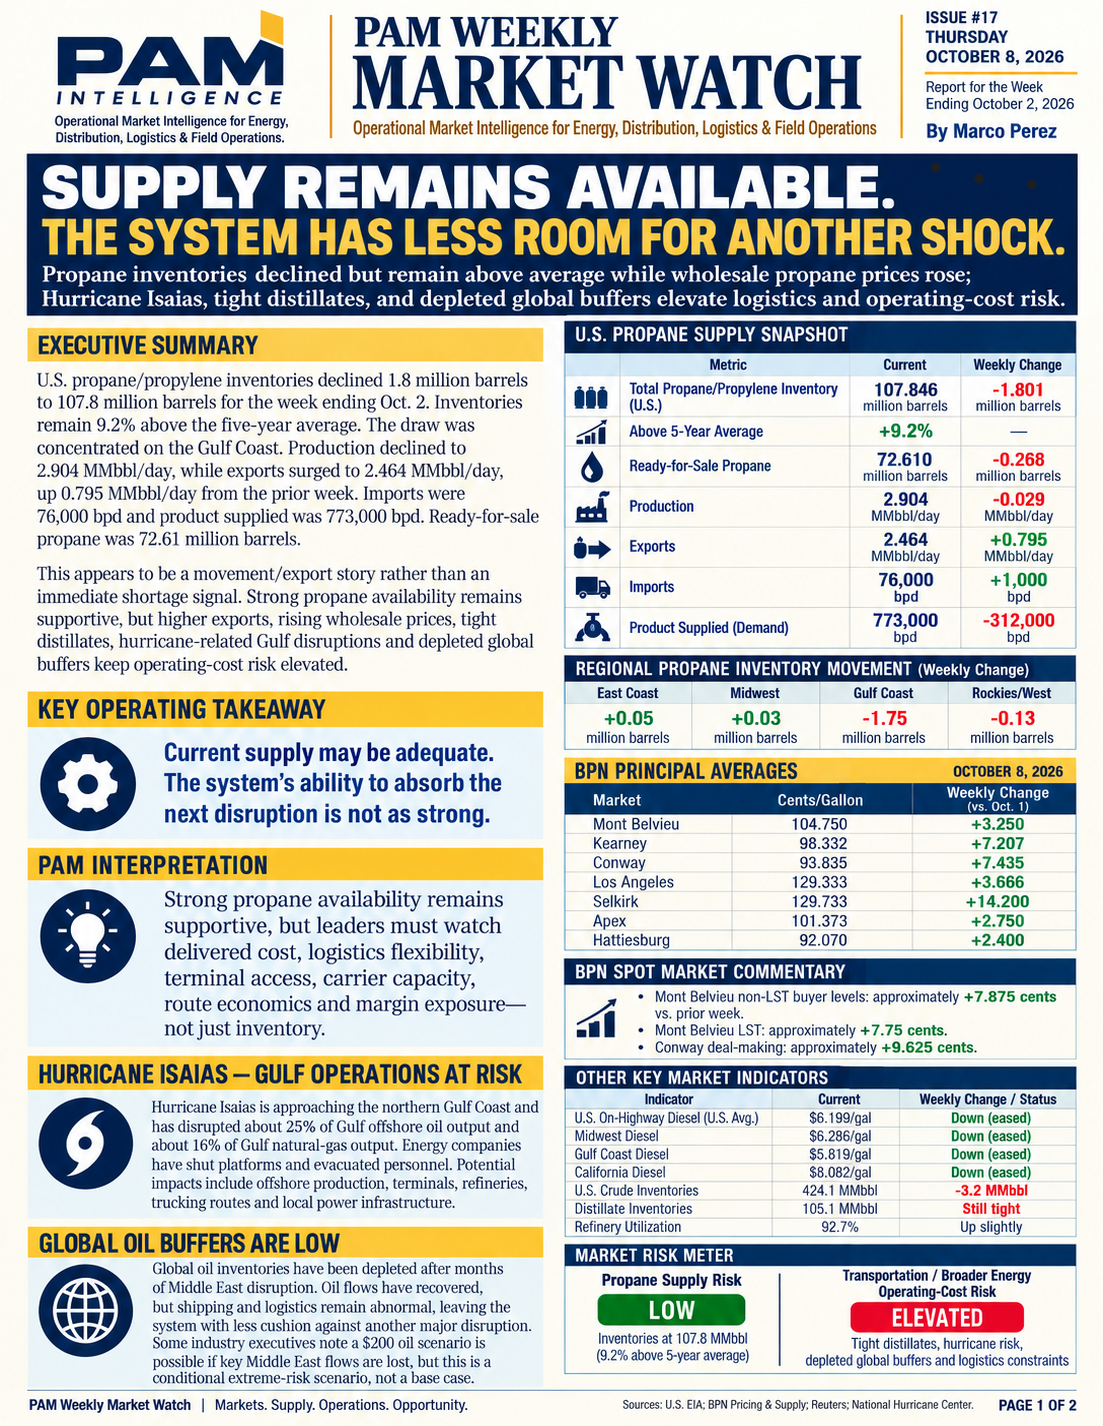
U.S. propane/propylene inventories declined 1.8 million barrels to 107.8 million barrels for the week ending October 2. Inventories remained 9.2% above the five-year average. The draw was concentrated on the Gulf Coast. Production declined to 2.904 MMbbl/day, while exports surged to 2.464 MMbbl/day, up 0.795 MMbbl/day from the prior week. Imports were 76,000 bpd and product supplied was 773,000 bpd. Ready-for-sale propane was 72.61 million barrels.
This appeared to be a movement/export story rather than an immediate shortage signal. Strong propane availability remained supportive, but higher exports, rising wholesale prices, tight distillates, hurricane-related Gulf disruptions, and depleted global buffers kept operating-cost risk elevated.
Core conclusion: Supply remains available. The system has less room for another shock.
U.S. Propane Supply Snapshot
| Metric | Current | Weekly change |
|---|---|---|
| Total propane/propylene inventory | 107.846 million barrels | −1.801 million barrels |
| Above five-year average | 9.2% | — |
| Ready-for-sale propane | 72.610 million barrels | −0.268 million barrels |
| Production | 2.904 MMbbl/day | −0.029 MMbbl/day |
| Exports | 2.464 MMbbl/day | +0.795 MMbbl/day |
| Imports | 76,000 bpd | +1,000 bpd |
| Product supplied | 773,000 bpd | −312,000 bpd |
Inventories declined, but remained comfortably above average. The draw was concentrated on the Gulf Coast, while the East Coast and Midwest increased slightly. Overall supply remained supportive.
Regional Propane Inventory Movement
- East Coast: +0.05 million barrels
- Midwest: +0.03 million barrels
- Gulf Coast: −1.75 million barrels
- Rockies/West: −0.13 million barrels
BPN Principal Averages — October 8, 2026
| Market | Cents/gallon | Weekly change vs. October 1 |
|---|---|---|
| Mont Belvieu | 104.750¢ | +3.250¢ |
| Kearney | 98.332¢ | +7.207¢ |
| Conway | 93.835¢ | +7.435¢ |
| Los Angeles | 129.333¢ | +3.666¢ |
| Selkirk | 129.733¢ | +14.200¢ |
| Apex | 101.373¢ | +2.750¢ |
| Hattiesburg | 92.070¢ | +2.400¢ |
BPN Spot Market Commentary
- Mont Belvieu non-LST buyer levels: approximately +7.875 cents versus the prior week.
- Mont Belvieu LST: approximately +7.75 cents.
- Conway deal-making: approximately +9.625 cents.
These prices and observations are preserved in their October 8, 2026 historical context.
Diesel & Fleet Operations
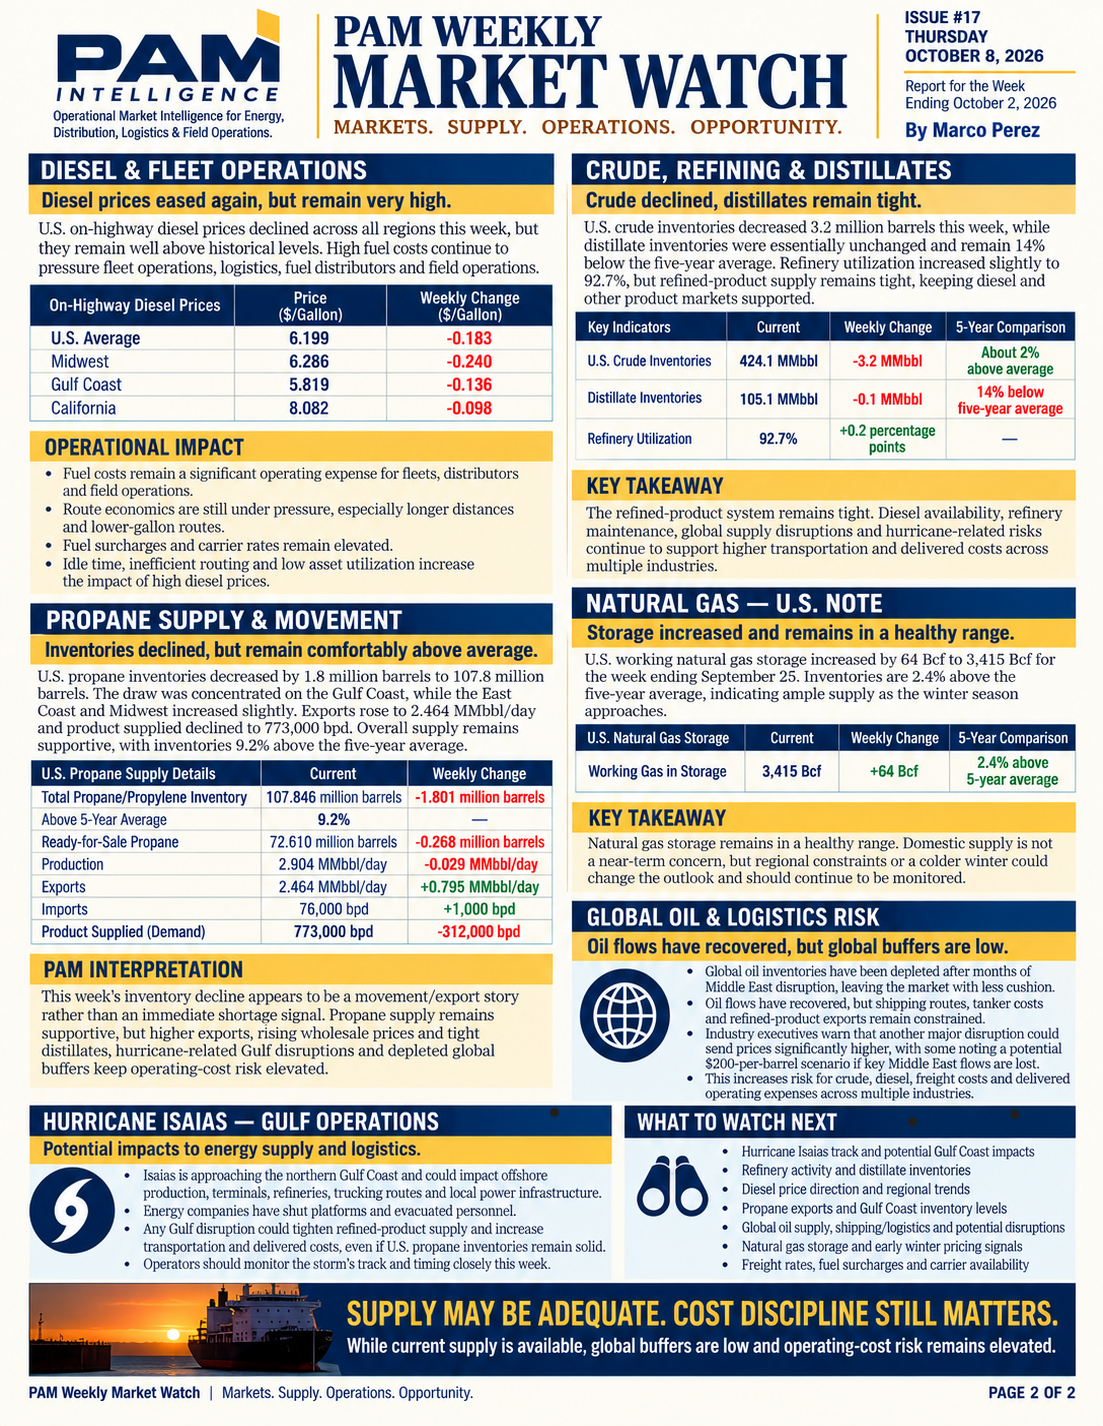
Diesel prices eased again, but remained very high. U.S. on-highway diesel prices declined across all regions, but remained well above historical levels. High fuel costs continued to pressure fleet operations, logistics, fuel distributors, and field operations.
| Region | Price per gallon | Weekly change |
|---|---|---|
| U.S. | $6.199 | −$0.183 |
| Midwest | $6.286 | −$0.240 |
| Gulf Coast | $5.819 | −$0.136 |
| California | $8.082 | −$0.098 |
Operational Impact
- Fuel costs remained a significant operating expense for fleets, distributors, and field operations.
- Route economics remained under pressure, especially for longer distances and lower-gallon routes.
- Fuel surcharges and carrier rates remained elevated.
- Idle time, inefficient routing, and low asset utilization increased the impact of high diesel prices.
Crude, Refining & Distillates
Crude declined; distillates remained tight. U.S. crude inventories decreased 3.2 million barrels, while distillate inventories were essentially unchanged and remained 14% below the five-year average. Refinery utilization increased slightly to 92.7%, but refined-product supply remained tight, keeping diesel and other product markets supported.
| Indicator | Current | Weekly change | Five-year comparison |
|---|---|---|---|
| U.S. crude inventories | 424.1 MMbbl | −3.2 MMbbl | About 2% above average |
| Distillate inventories | 105.1 MMbbl | −0.1 MMbbl | 14% below average |
| Refinery utilization | 92.7% | +0.2 percentage points | — |
The refined-product system remained tight. Diesel availability, refinery maintenance, global supply disruptions, and hurricane-related risks continued to support higher transportation and delivered costs across multiple industries.
Hurricane Isaias — Gulf Operations at Risk
Event-specific historical intelligence as reported October 8, 2026. Hurricane Isaias was approaching the northern Gulf Coast and had disrupted about 25% of Gulf offshore oil output and about 16% of Gulf natural-gas output. Energy companies had shut platforms and evacuated personnel.
Potential impacts included offshore production, terminals, refineries, trucking routes, local power infrastructure, and Gulf Coast logistics. Any Gulf disruption could tighten refined-product supply and increase transportation and delivered costs even if U.S. propane inventories remained solid.
Evergreen operating lesson: Adequate national supply does not eliminate regional operational exposure when weather, infrastructure, terminal access, transportation, or power are disrupted.
Global Oil & Logistics Risk
Oil flows had recovered, but global buffers were low. Global oil inventories had been depleted after months of Middle East disruption, leaving the market with less cushion. Shipping routes, tanker costs, and refined-product exports remained constrained. These conditions increased risk for crude, diesel, freight costs, and delivered operating expenses across multiple industries.
The report cited industry executives warning that another major disruption could send prices significantly higher, with some noting a potential $200-per-barrel scenario if key Middle East flows were lost. This was a conditional extreme-risk scenario cited in the October 8 report—not PAM’s base-case forecast and not a current prediction.
Natural Gas — U.S. Note
U.S. working natural-gas storage increased by 64 Bcf to 3,415 Bcf for the week ending September 25. Inventories were 2.4% above the five-year average, indicating ample supply as the winter season approached. Domestic supply was not a near-term concern, but regional constraints or a colder winter could change the outlook and warranted continued monitoring.
Historical Market Risk Meter
Propane Supply Risk: LOW. Inventories were 107.8 million barrels and 9.2% above the five-year average.
Transportation / Broader Energy Operating-Cost Risk: ELEVATED. Tight distillates, hurricane risk, depleted global buffers, and logistics constraints reduced the system’s cushion.
These ratings reflect PAM’s October 8, 2026 assessment and must not be read as present-day conditions.
What to Watch Next
- Hurricane Isaias track and potential Gulf Coast impacts
- Refinery activity and distillate inventories
- Diesel price direction and regional trends
- Propane exports and Gulf Coast inventory levels
- Global oil supply, shipping/logistics, and potential disruptions
- Natural-gas storage and early winter pricing signals
- Freight rates, fuel surcharges, and carrier availability
This watch list is preserved as historical forward-looking context from October 8, 2026.
PAM Interpretation
Strong propane availability remained supportive, but leaders needed to watch delivered cost, logistics flexibility, terminal access, carrier capacity, route economics, and margin exposure—not just inventory.
Supporting conclusion: Supply may be adequate. Cost discipline still matters.
ASK PAM
Put This Market Watch to Work
Management question: “Supply is available today, but the system has less ability to absorb another disruption. What should management do before another shock occurs?”
- What is happening? As reported October 8, 2026, propane supply remained available, but higher exports, rising wholesale prices, tight distillates, hurricane-related Gulf exposure, constrained logistics, and low global buffers reduced the system’s cushion.
- What should we measure? Measure inventory position by location, terminal access, days of usable supply, supplier alternatives, committed and backup carrier capacity, transportation and delivered cost, distillate exposure, route flexibility, and the customers affected first by reduced capacity.
- What may be causing it? Gulf Coast inventory movement, export demand, terminal or refinery disruption, carrier constraints, high diesel and freight cost, infrastructure or power interruption, and dependence on a single supplier, terminal, route, or decision-maker can turn adequate national supply into local operating exposure.
- What can management control? Management can qualify alternate suppliers and terminals, confirm carrier capacity, redesign routes, clarify emergency decision authority, prioritize customers and essential work, protect key information, and define backup operating options.
- What decision may need to be made? Leaders may need to pre-position supply, reserve transportation, shift terminal or carrier choices, temporarily change customer commitments, or authorize local managers to act within defined limits before disruption occurs.
- What practical step comes next? Run a bad-day review for one plausible Gulf, terminal, carrier, or power disruption: identify what stops, which customers are affected first, who can decide, what backup exists, and how long the operation can continue.
This answer uses the report’s dated October 8, 2026 market evidence and approved PAM operational-resilience principles. It does not represent current market or hurricane conditions.