Web Edition
Supply may be adequate. Cost discipline still matters.
View Designed Edition2 original revised publication pagesExecutive Summary
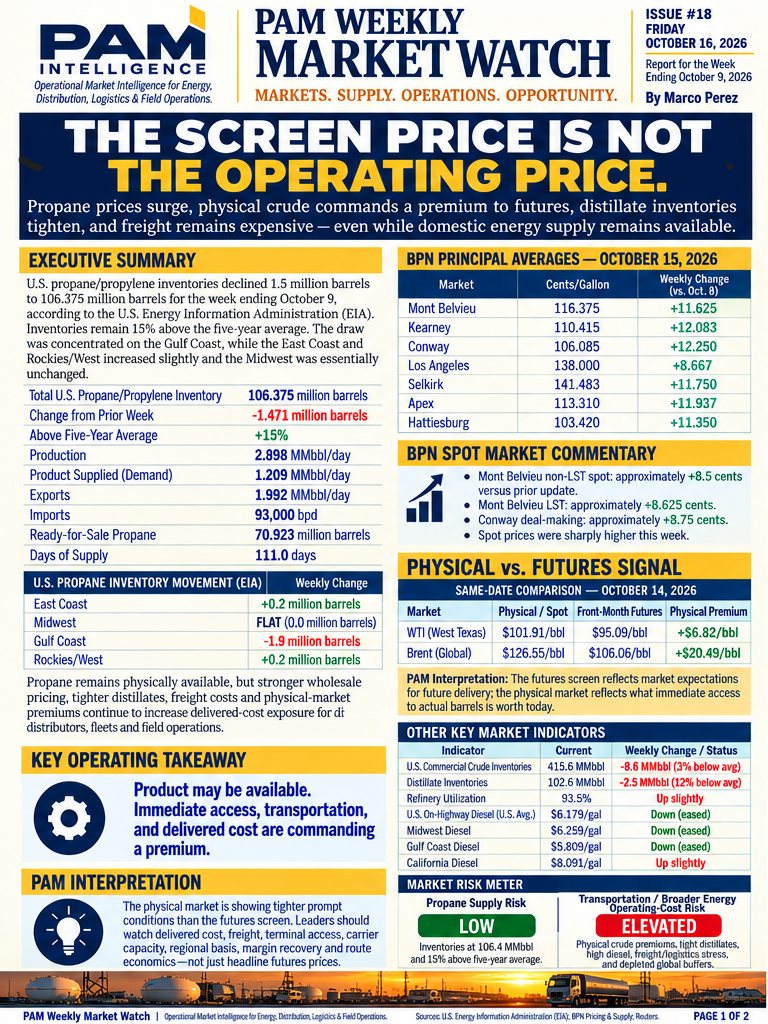
U.S. propane/propylene inventories declined 1.5 million barrels to 106.375 million barrels for the week ending October 9, according to the U.S. Energy Information Administration. Inventories remained 15% above the five-year average. The draw was concentrated on the Gulf Coast, while the East Coast and Rockies/West increased slightly and the Midwest was essentially unchanged.
Propane remained physically available, but stronger wholesale pricing, tighter distillates, freight costs, and physical-market premiums continued to increase delivered-cost exposure for distributors, fleets, and field operations.
Core operating conclusion: The screen price is not the operating price.
U.S. Propane Supply Snapshot
| Metric | Current | Weekly change/status |
|---|---|---|
| Total U.S. propane/propylene inventory | 106.375 million barrels | −1.471 million barrels |
| Above five-year average | 15% | — |
| Production | 2.898 MMbbl/day | — |
| Product supplied | 1.209 MMbbl/day | — |
| Exports | 1.992 MMbbl/day | — |
| Imports | 93,000 bpd | — |
| Ready-for-sale propane | 70.923 million barrels | — |
| Days of supply | 111.0 days | — |
Regional Inventory Movement
- East Coast: +0.2 million barrels
- Midwest: flat (0.0 million barrels)
- Gulf Coast: −1.9 million barrels
- Rockies/West: +0.2 million barrels
Key operating takeaway: Product may be available. Immediate access, transportation, and delivered cost are commanding a premium.
BPN Principal Averages — October 15, 2026
| Market | Cents/gallon | Weekly change vs. October 8 |
|---|---|---|
| Mont Belvieu | 116.375¢ | +11.625¢ |
| Kearney | 110.415¢ | +12.083¢ |
| Conway | 106.085¢ | +12.250¢ |
| Los Angeles | 138.000¢ | +8.667¢ |
| Selkirk | 141.483¢ | +11.750¢ |
| Apex | 113.310¢ | +11.937¢ |
| Hattiesburg | 103.420¢ | +11.350¢ |
BPN Spot Market Commentary
- Mont Belvieu non-LST spot: approximately +8.5 cents versus the prior update.
- Mont Belvieu LST: approximately +8.625 cents.
- Conway deal-making: approximately +8.75 cents.
- Spot prices were sharply higher this week.
These are historical October 15, 2026 prices and observations.
Physical vs. Futures Signal
Same-date comparison — October 14, 2026.
| Market | Physical/spot | Front-month futures | Physical premium |
|---|---|---|---|
| WTI (West Texas) | $101.91/bbl | $95.09/bbl | +$6.82/bbl |
| Brent (Global) | $126.55/bbl | $106.06/bbl | +$20.49/bbl |
PAM Interpretation: The futures screen reflects market expectations for future delivery; the physical market reflects what immediate access to actual barrels was worth on October 14, 2026. The physical market was showing tighter prompt conditions than the futures screen. These premiums are date-specific and are not permanent or current values.
Diesel & Fleet Operations
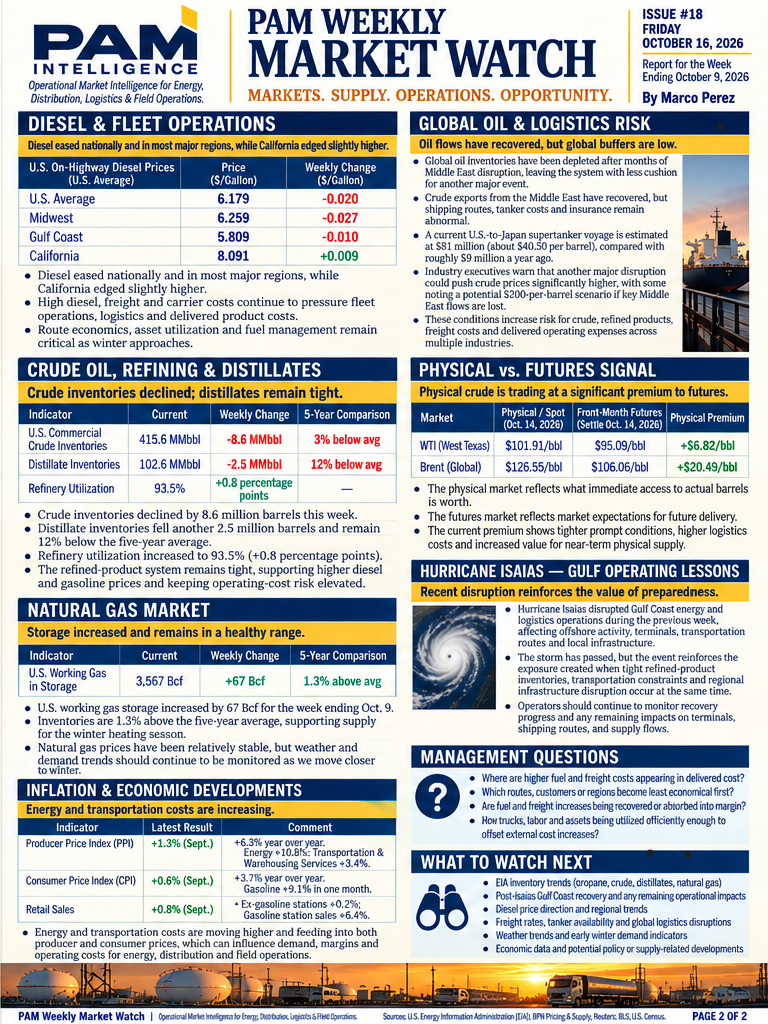
Diesel eased nationally and in most major regions, while California edged slightly higher.
| Region | Price per gallon | Weekly change |
|---|---|---|
| U.S. | $6.179 | −$0.020 |
| Midwest | $6.259 | −$0.027 |
| Gulf Coast | $5.809 | −$0.010 |
| California | $8.091 | +$0.009 |
- High diesel, freight, and carrier costs continued to pressure fleet operations, logistics, and delivered product costs.
- Route economics, asset utilization, and fuel management remained critical as winter approached.
Crude Oil, Refining & Distillates
Crude inventories declined; distillates remained tight.
| Indicator | Current | Weekly change | Five-year comparison |
|---|---|---|---|
| U.S. commercial crude inventories | 415.6 MMbbl | −8.6 MMbbl | 3% below average |
| Distillate inventories | 102.6 MMbbl | −2.5 MMbbl | 12% below average |
| Refinery utilization | 93.5% | +0.8 percentage points | — |
The refined-product system remained tight, supporting higher diesel and gasoline prices and keeping operating-cost risk elevated.
Natural Gas Market
Storage increased and remained in a healthy range.
| Indicator | Current | Weekly change | Five-year comparison |
|---|---|---|---|
| U.S. working gas in storage | 3,567 Bcf | +67 Bcf | 1.3% above average |
Natural-gas prices had been relatively stable, but weather and demand trends should continue to be monitored as winter approached.
Global Oil & Logistics Risk
Oil flows had recovered, but global buffers were low. Global oil inventories had been depleted after months of Middle East disruption. Shipping routes, tanker costs, and insurance remained abnormal. A current U.S.-to-Japan supertanker voyage was estimated at $81 million—about $40.50 per barrel—compared with roughly $9 million a year earlier.
Industry executives warned that another major disruption could push crude prices significantly higher, with some noting a potential $200-per-barrel scenario if key Middle East flows were lost. This was a conditional extreme-risk scenario cited in the October 16 report—not PAM’s base-case forecast and not a current prediction.
Hurricane Isaias — Gulf Operating Lessons
Historical event intelligence—not an active storm. The recent disruption reinforced the value of preparedness. Isaias disrupted Gulf Coast energy and logistics operations during the previous week, affecting offshore activity, terminals, transportation routes, and local infrastructure. The storm had passed, but recovery effects required continued monitoring.
Evergreen operating lesson: Regional infrastructure, terminal, transportation, power, and supply-chain disruption can increase operating exposure even when national supply remains adequate.
Inflation & Economic Developments
Energy and transportation costs were increasing.
| Indicator | Latest result | Historical October 16 context |
|---|---|---|
| Producer Price Index (PPI) | +1.3% in September | +6.3% year over year; energy +10.8%; transportation and warehousing services +3.4% |
| Consumer Price Index (CPI) | +0.6% in September | +3.7% year over year; gasoline +9.1% in one month |
| Retail sales | +0.8% in September | Ex-gasoline stations +0.2%; gasoline-station sales +6.4% |
Energy and transportation costs were moving higher and feeding into both producer and consumer prices, which could influence demand, margins, and operating costs across energy, distribution, and field operations.
Historical Market Risk Meter
Propane Supply Risk: LOW. Inventories were 106.4 million barrels and 15% above the five-year average.
Transportation / Broader Energy Operating-Cost Risk: ELEVATED. Physical crude premiums, tight distillates, high diesel, freight/logistics stress, and depleted global buffers increased exposure.
These ratings are PAM’s dated October 16, 2026 assessment, not current conditions.
Management Questions
- Where are higher fuel and freight costs appearing in delivered cost?
- Which routes, customers, or regions become least economical first?
- Are fuel and freight increases being recovered or absorbed into margin?
- How much supplier, terminal, carrier, and route flexibility exists?
- Are trucks, labor, and assets being utilized efficiently enough to offset external cost increases?
What to Watch Next
- EIA inventory trends across propane, crude, distillates, and natural gas
- Post-Isaias Gulf Coast recovery and any remaining operational impacts
- Diesel price direction and regional trends
- Freight rates, tanker availability, and global logistics disruptions
- Weather trends and early winter demand indicators
- Economic data and potential policy or supply-related developments
This is historical forward-looking context from October 16, 2026.
ASK PAM
Put This Market Watch to Work
Management question: “The market screen says one thing, but my actual delivered cost is increasing. What should management measure to understand the real operating price?”
- What is happening? The dated October 16 report showed available domestic supply, but wholesale prices, prompt physical premiums, freight, diesel, regional basis, and logistics costs were increasing the real delivered price.
- What should we measure? Measure commodity/acquisition cost, physical premium, regional basis, freight, fuel surcharge, terminal distance, carrier cost, route miles, gallons per stop, asset utilization, labor and overtime, and margin recovery by route, customer, and region.
- What may be causing it? Tight prompt supply at the point of access, terminal constraints, carrier scarcity, long hauls, high diesel, inefficient routes, low drop size, weak asset utilization, and unrecovered surcharges can separate operating price from the futures screen.
- What can management control? Management can compare terminals and suppliers, negotiate carrier capacity, redesign routes, increase gallons per stop, reduce empty miles and idle time, improve asset use, and align pricing or surcharges with delivered cost.
- What decision may need to be made? Leaders may need to change sourcing, terminal, carrier, route, service commitment, or pricing decisions where the full operating price cannot be recovered.
- What practical step comes next? Build a one-week delivered-cost bridge from screen/acquisition price through physical premium, basis, freight, fuel, labor, route miles, and margin. Review the largest gaps before changing routes or customer commitments.
This answer uses dated October 16, 2026 market evidence and approved PAM operating principles. It does not represent current market conditions or company-specific costs.